A mature quant practice with no view of cause.
The analytics team could see exactly what was happening. They couldn't see why.
Analytics found the leak, but not the cause
The client's optimization team had a mature quantitative practice: web analytics, conversion tracking, and A/B testing. But the team was mostly optimizing from transactional behavior. They knew where the lead funnel was struggling, but lacked the qualitative evidence needed to understand the user experience behind the numbers.
The immediate signal was a two-step lead form. Back-button clicks had increased by more than 100% year over year, suggesting users were uncertain about what would happen next, what information was required, or whether they were ready to request a quote. Tens of thousands of daily visitors were moving through a funnel where small moments of confusion became meaningful business loss.
The current journey showed multiple places where confidence dropped
Anonymized artifact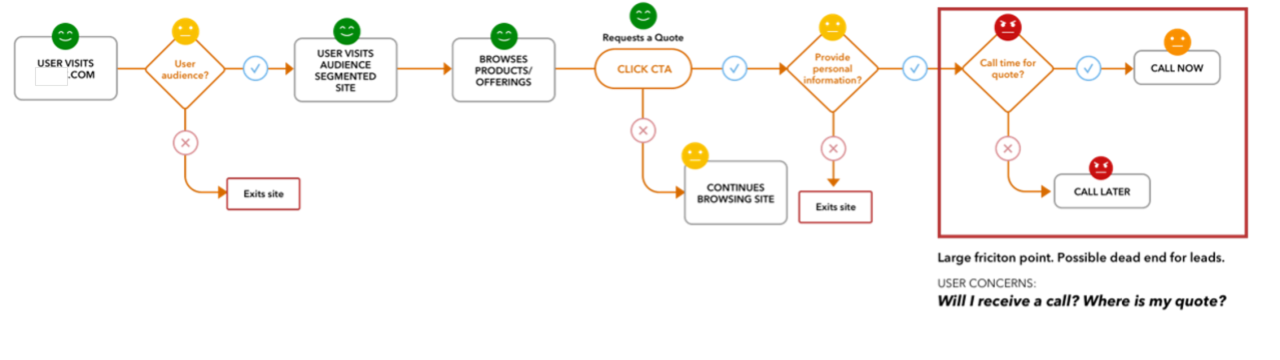
The problem was not isolated to the form. The journey revealed confidence drops across messaging, product understanding, the estimator, and contact expectations, all of which shaped whether users felt ready to become leads.
One study would not change how decisions got made.
Not a usability test, a mixed-method optimization engine
A one-off usability study would have identified issues, but it would not have changed how the organization made optimization decisions. The bigger opportunity was to connect qualitative evidence to the existing quantitative practice so every future experiment had a stronger behavioral rationale.
The work shifted from run a usability test, to build a repeatable way to turn how customers behave into better experiment decisions.
A cadence, not a one-time study.
How the optimization program was grounded
The process combined self-site usability testing, competitive studies, behavioral analytics, experimentation planning, and a standardized metric framework. The intent was a repeatable cadence: diagnose friction, translate findings into testable hypotheses, prioritize by conversion impact, and validate with live experiments.
Self-site and competitive usability studies focused on the pages most important to conversion.
Usability behavior, web analytics, and A/B testing connected into a single decision process.
Effectiveness, efficiency, and satisfaction standardized into a single usability score.
Findings became a prioritized testing roadmap across form, messaging, calculator, and CTA patterns.
The research plan created a repeatable study-to-test pipeline
Planning artifacts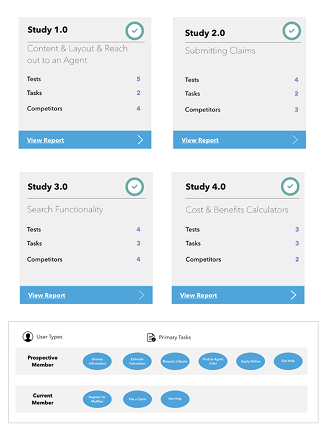
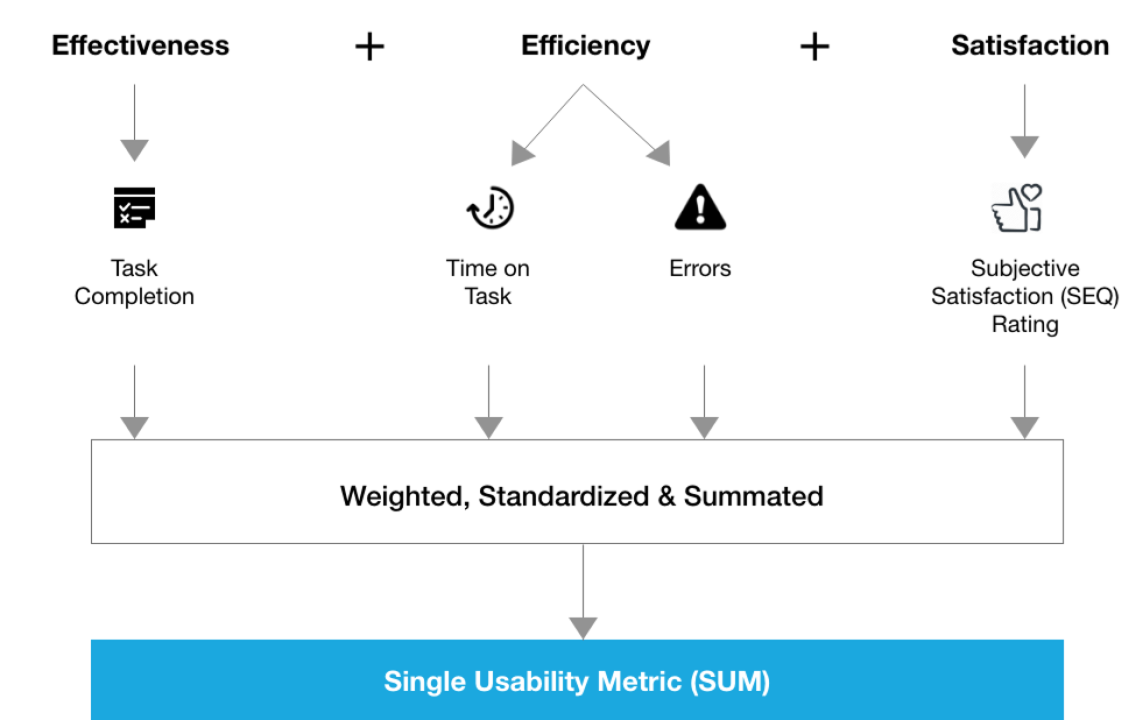
The method was intentionally operationalized. Each study was designed to produce comparable evidence, prioritized insights, and experiment-ready hypotheses rather than a static research report.
Confidence eroded in four different places.
Friction was not one problem
The research showed that users were not simply abandoning because the form was too long. Confidence eroded across the experience: confusing messaging, unclear cost information, inconsistent contact expectations, and benefits content that looked useful but required too much interpretation.
Messaging created confusion before the form
Users struggled to interpret campaign headlines and value propositions, which weakened confidence before they reached the conversion path.
The lead form created uncertainty
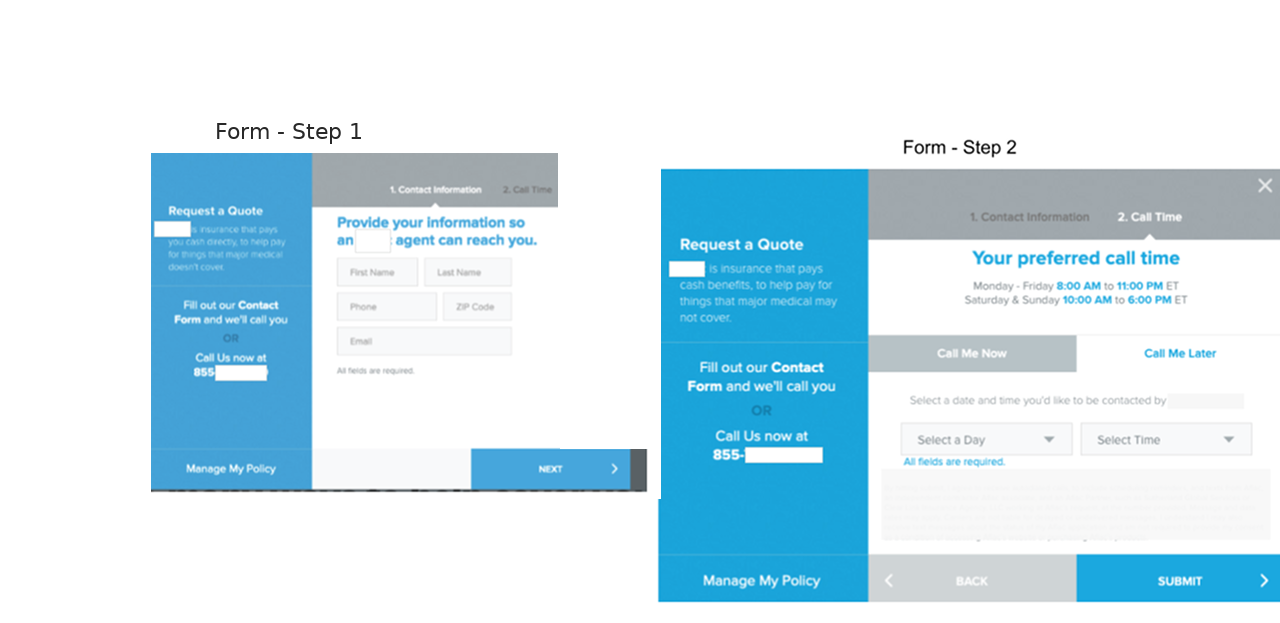
The two-step flow introduced ambiguity around call timing, contact expectations, and what would happen after submission.
The estimator looked helpful but was hard to trust
Users wanted cost clarity, but struggled to interpret product selections, numbers, and what monthly premium or coverage really meant.
Users wanted more control over contact
Research surfaced a strong preference for alternative contact paths, including live chat, especially when users were not ready for a phone call.
Patterns were translated into prioritized optimization opportunities
Research synthesis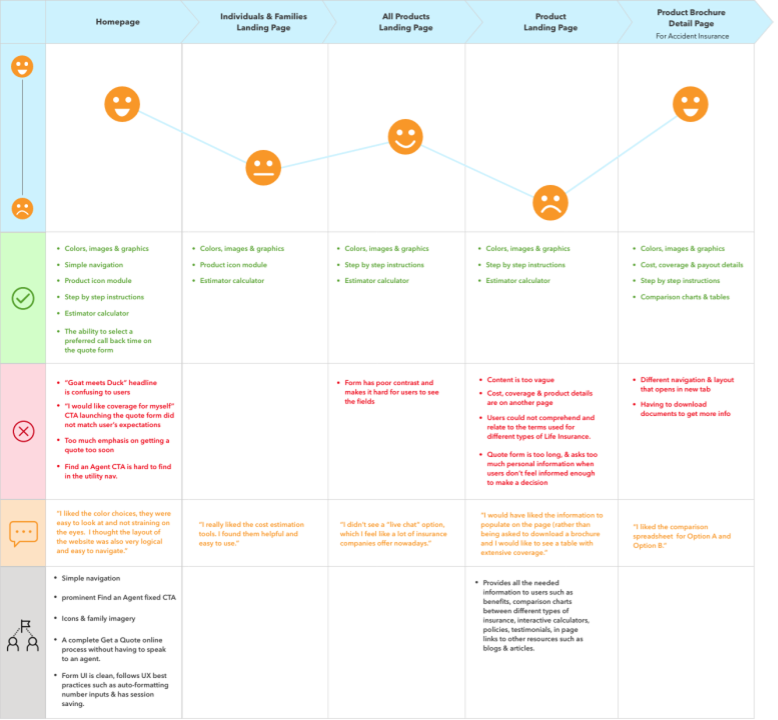
The synthesis connected observation to action. Findings were organized by page, task, user sentiment, open-ended feedback, and conversion relevance so issues could move directly into the testing backlog.
Every insight had to become measurable.
Turning behavioral evidence into a testing roadmap
Each insight was translated into a measurable experiment or future optimization idea. The goal was not to fix every issue at once. It was to prioritize the changes most likely to move conversion while improving the experience.
The form test proved the model.
The one-step form experiment proved the model
The clearest validation came from the lead-form experiment. Research showed that the two-step pattern was creating uncertainty. The experiment tested whether reducing friction and consolidating the form would improve conversion without sacrificing lead quality.
Reduced friction. Increased conversion.
Validated in productionThe one-step lead form turned a research-backed usability finding into measurable business impact. The result gave the team confidence that qualitative evidence could improve experiment selection, not just explain results after the fact.
Overall B2C lead conversion lift.
Desktop conversion lift at 99.98% confidence.
Click-to-call increase at 97% confidence.
Incremental lead growth over two months.
Experimentation and analytics closed the loop
Anonymized dashboards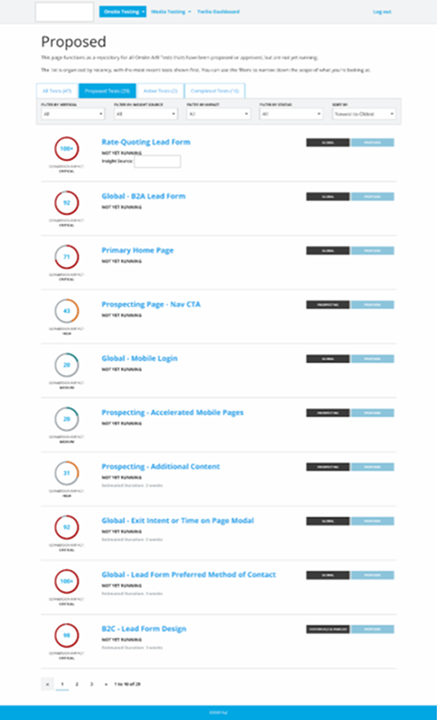
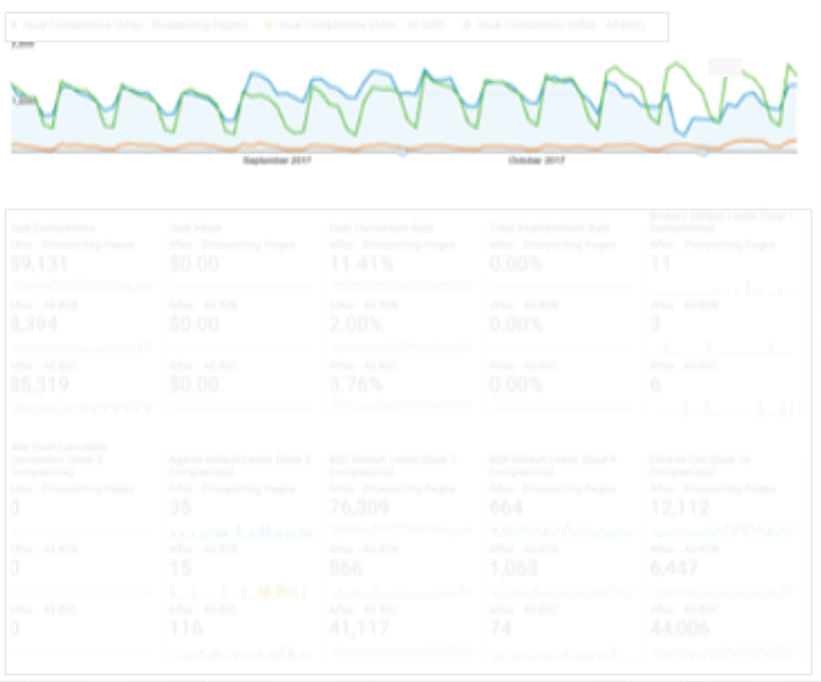
The output was a system, not a study. The research created a pipeline from usability evidence to A/B testing ideas, measurable results, and future optimization priorities.
Two signals with revenue attached.
Research created future revenue opportunities
The work also identified future optimization opportunities beyond the successful form test. One of the most valuable was live chat: usability testing showed a meaningful share of users preferred chat over phone or form-based contact, especially when they were still evaluating coverage and costs.
Users wanted information before committing
Cost, coverage, benefits, and contact expectations needed to be clearer before users felt ready to request a quote.
Improve informational support upstream
Add monthly premium guidance, clarify estimator logic, and support users before the lead form.
Phone calls were not always the preferred path
47% of users from testing preferred live chat as a communication method over phone or forms.
Recover leads lost from callback friction
Live chat was estimated to close a portion of leads lost through the "Call Me Later" path, representing a seven-figure annualized opportunity.
Qual and quant became one practice.
Optimization became more evidence-driven
The most durable outcome was not a single lift metric. It was proving that conversion optimization becomes stronger when analytics and experimentation are paired with human behavior evidence from the beginning.
The client name, proprietary feature labels, exact internal dashboards, and sensitive operational details are anonymized or blurred. The case study preserves the method, decision logic, and measurable outcome while protecting client-specific information.
The contribution was the bridge.
The real contribution was the bridge
This work reinforced a simple pattern. Analytics are powerful at locating behavior, but they rarely explain it. Usability research can explain behavior, but it becomes more influential when connected to measurable business outcomes.
The value of the work was building the bridge between the two: a process where research generated better hypotheses, experimentation validated them in production, and the organization had a stronger basis for deciding what to optimize next.
The work was not usability testing, and it was not A/B testing. It was the system that connected them.